


 0
0
How to solve Bar Charts Quickly

How To Solve Bar Chart- In Data Interpretation.
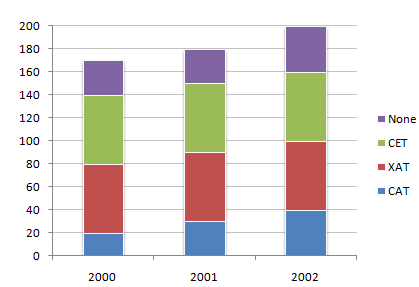
The following chart represents the number of students who passed the CAT exam or the XAT exam or the CET exam or None of these exams. (Assume that there are no students who passed more than one exam.)
Number of students who qualified CAT/XAT/CET Exams
Question1.
| Which year showed the best result in MBA entrance exams (in terms of percentage of students who cleared) ? | ||||||||
|
Answer: Option B
Explanation:
Compare the respective pass percentage for three years : 2000, 2001 and 2002
= (140 x 100)/170 < (150 x 100)/180 and (150 x 100)/180 > (160 x 100)/200
= 82.35% < 83.33% and 83.33% > 80%
Question 2.
What was the percentage of students who succeeded in at least one of three exams in 2000 ?
| A. | 82.4 % |
| B. | 82.8 % |
| C. | 82.35 % |
| D. | 83.3 % |
Explanation:
Total percentage of students who succeeded in at least one of three exams in 2000 = (140 x 100)/170 = 82.35 %
Question 3.
| What is the percentage increase in the number of students in 2002 over 2000 ? | ||||||||
|
Answer: Option B
Explanation:
Total percentage increase in the number of students in 2002 over 2000 is = (30 x 100)/170 = 17.64 %
Question 4.
| What is the percentage of students who cleared CAT in 2000 ? | ||||||||
|
Answer: Option D
Explanation:
Total percentage of students who cleared CAT in 2000 = (20 x 100)/170 = 11.76 %